Website speed optimization for Webflow: the Core Web Vitals playbook
A fast website is no longer a nice-to-have, it's a baseline expectation. Google uses Core Web Vitals as a ranking signal, users abandon pages that take more than a few seconds to load, and every fraction of a second affects your conversion rate. Webflow gives you a strong foundation for performance, but the platform alone won't carry you to a top-tier score. This playbook walks through the most common Webflow speed issues we see at BORING and exactly how to fix them, so your website speed optimization efforts actually move the metrics that matter.

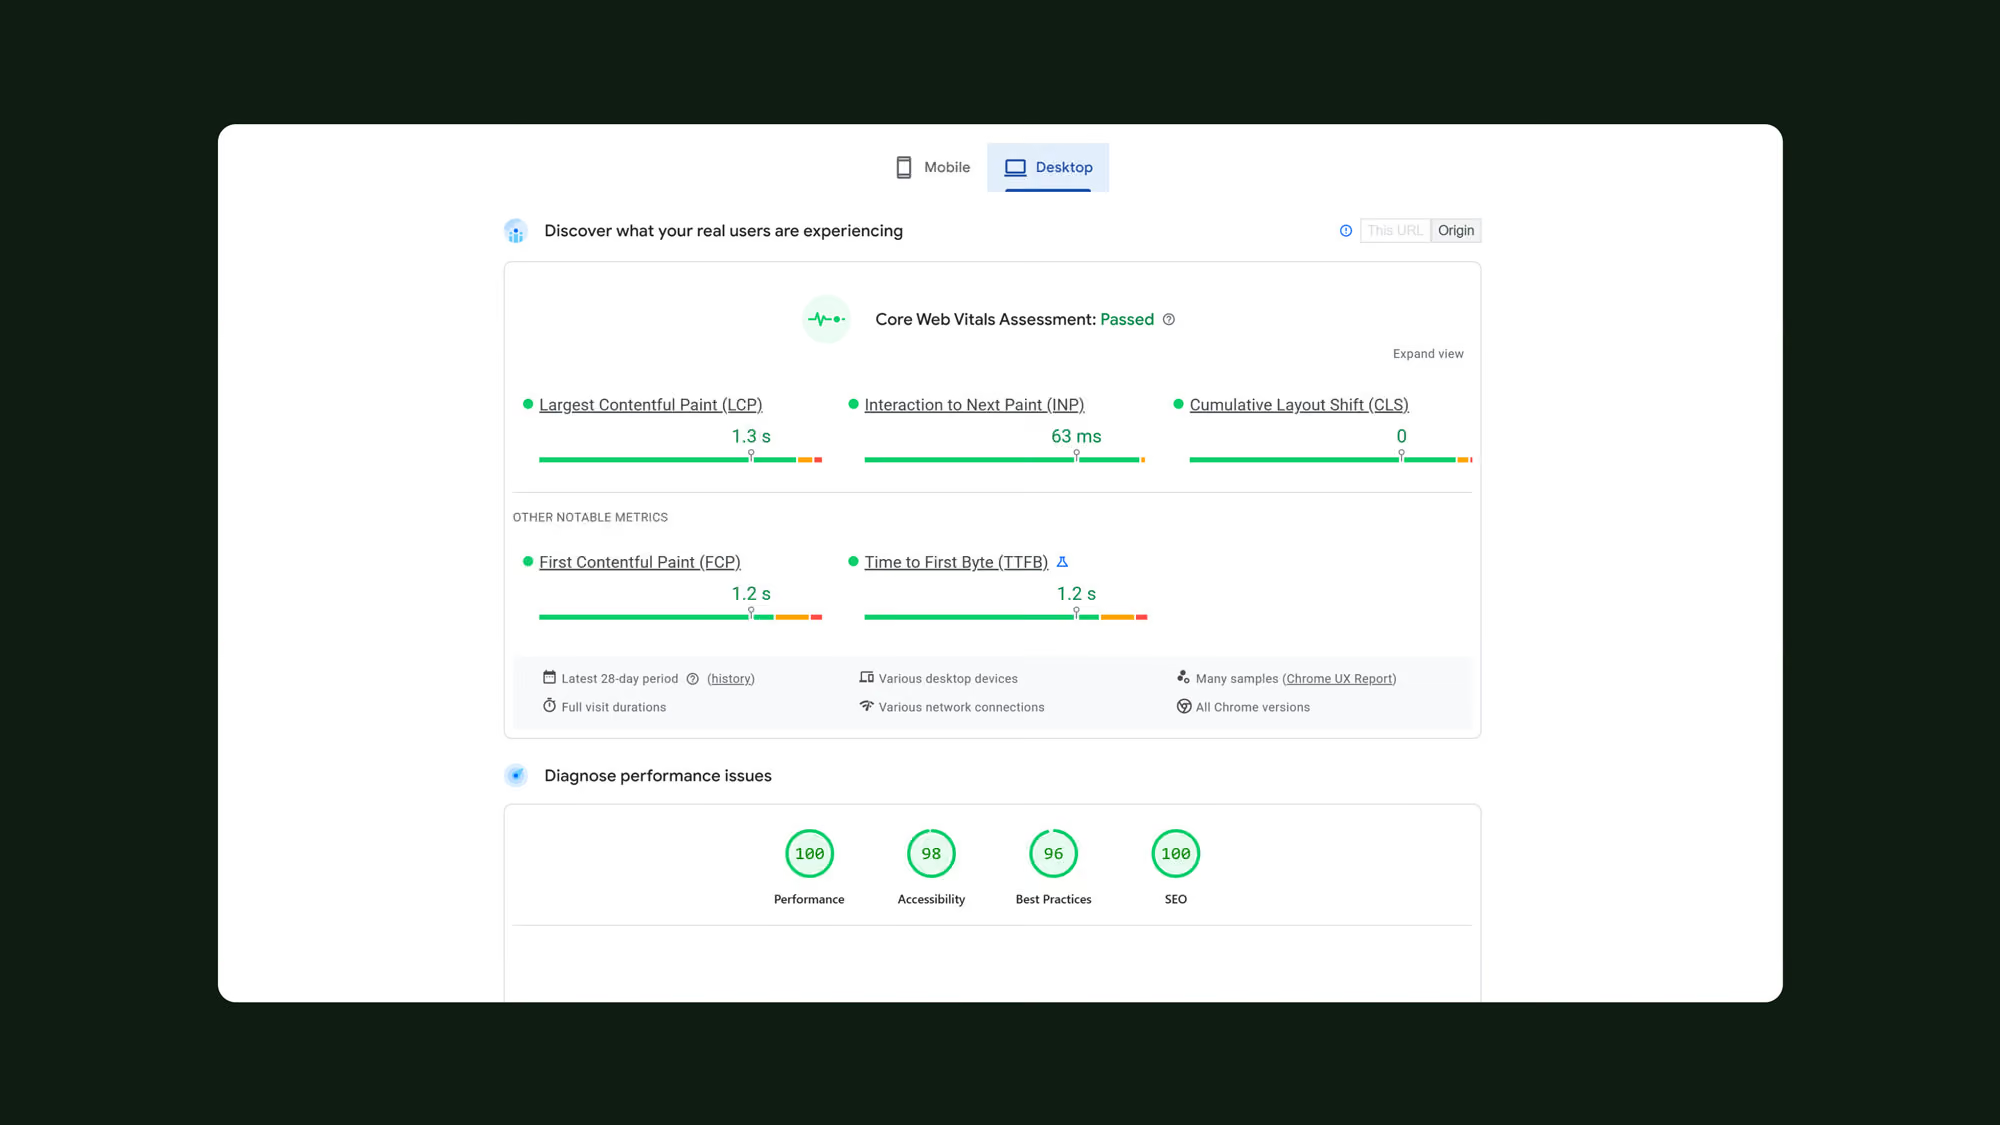
Webflow website speed optimization comes down to passing Core Web Vitals on real-user data. The biggest levers are compressing images before upload, limiting fonts and third-party scripts, auditing Interactions, and measuring with PageSpeed Insights and Search Console. This playbook covers the most common Webflow speed issues and exactly how to fix them.
Why website speed optimization matters for Webflow sites
A slow site costs you twice: it hurts your search rankings, because Google uses page experience signals, including Core Web Vitals, as part of its ranking algorithm; and it hurts your conversion rate, because users don't want to wait around. Google's own research shows that the probability of a bounce climbs 32% as load time goes from one to three seconds, and 90% by five seconds. Visitors don't wait, and search engines reflect that.
Webflow has a real performance advantage out of the box. The platform is hosted on AWS, served through Fastly's global CDN, and produces clean, semantic code. SSL and HTTP/2 are handled automatically, and responsive image variants are generated for every upload. Compared to a typical WordPress install with a dozen plugins fighting for resources, a Webflow site starts the race ahead.
That doesn't mean Webflow sites are immune to performance problems. The same flexibility that makes Webflow attractive (custom fonts, complex interactions, CMS-heavy templates, embedded third-party tools) is also what slows sites down when used carelessly. Most Webflow performance issues come from how a site is built and maintained, not from the platform itself. The good news is that nearly all of them are fixable without writing custom code.
Core Web Vitals explained
Core Web Vitals are Google's three measurements of real-world user experience. Unlike Lighthouse scores, which are simulated in a lab environment, Core Web Vitals are based on field data: actual user sessions tracked through the Chrome User Experience Report (CrUX). To pass, a site needs at least 75% of page visits to hit the "good" threshold for each metric.
Largest Contentful Paint (LCP)
LCP measures how long it takes for the largest visible element on a page to render. Usually that's a hero image, video, or a large block of text. The "good" threshold is under 2.5 seconds.
On Webflow sites, LCP problems almost always trace back to a heavy hero image, slow server response, or render-blocking scripts and stylesheets. The fix is straightforward: optimize the hero image, preload critical assets, and minimize anything that delays the first paint.
Interaction to Next Paint (INP)
INP replaced First Input Delay (FID) in March 2024 as the official responsiveness metric. It measures the delay between a user interacting with the page (clicking, tapping, typing) and the next visual update. The threshold is under 200 milliseconds.
INP issues on Webflow sites usually come from heavy JavaScript: too many custom interactions, third-party scripts running on every event, or oversized Lottie files trying to animate at the same time. Reducing JavaScript work on the main thread is what moves the needle.
Cumulative Layout Shift (CLS)
CLS measures visual stability, or how much the page jumps around as it loads. The threshold is a score under 0.1, where 0 means no layout shift at all. Scores between 0.1 and 0.25 need improvement, and anything above 0.25 is considered a poor experience.
The most common CLS culprits in Webflow are images without explicit dimensions, late-loading web fonts that swap and reflow text, ad units, and embedded content that loads after the surrounding layout. The fix is to reserve space for any element that loads asynchronously.
Common Webflow speed issues and how to fix them
How do you optimize images for Webflow speed?
Images are the single biggest performance lever on most Webflow sites. The platform helps in three ways automatically: it generates responsive image variants for every upload, serves WebP versions through its CDN to browsers that support them (when asset optimization is enabled in your project settings), and applies native lazy loading by default. That covers delivery, but not what you upload in the first place.
Webflow does not aggressively compress images at upload, so you need to do that yourself before adding them to the asset manager. For a first compression pass, we use TinyJPG, which reduces file size significantly before you go anywhere near Webflow. From there, convert to WebP or AVIF and aim for hero images under 200KB and most secondary images well under 100KB. The difference between a 2MB JPEG and a 120KB WebP or AVIF is invisible to the eye and significant to your LCP score. As a rule of thumb, anything over 750KB before upload should be flagged for compression.
Set explicit dimensions on every image in the Designer rather than letting the browser scale them down on the fly. This also tells the browser how much space to reserve, which prevents the layout shifts that damage your CLS score. For background images, which don't benefit from Webflow's responsive variants, manually upload optimized versions sized for each breakpoint. And every image needs a descriptive, keyword-relevant alt attribute, both for accessibility and for SEO.
Keeping image file sizes down also has a practical benefit beyond performance: it directly reduces the bandwidth your site consumes each month. If you are on a CMS plan, that matters more than ever. Our guide on how to stay within your Webflow bandwidth limit covers this in more detail.
How does font loading affect Webflow speed?
Custom fonts are one of the easier wins on a Webflow site. Every additional font family and weight is an extra network request and an extra file the browser has to parse before it can render text.
Limit yourself to two font families maximum, with no more than three weights each. If you're using a typeface for a single heading, consider whether a system font would do the job. Where possible, use web font formats: WOFF2 is the most efficient, with WOFF as a fallback for older browsers. Both are significantly smaller in file size than TTF or OTF equivalents.
Upload your fonts directly to Webflow rather than importing from Google Fonts via custom CSS. The built-in font manager is faster and uses font-display: swap, which prevents invisible text during load. Where possible, subset your fonts to include only the characters and language sets you actually use, and preload critical above-the-fold typography in the page head.
How do you handle render-blocking scripts in Webflow?
Third-party scripts are the silent killer of Webflow performance. Google Tag Manager, HubSpot, Intercom, Hotjar, chat widgets, A/B testing tools. Each one adds weight, and they tend to accumulate over time without anyone auditing what's still in use.
Start by listing every third-party script your site loads. For each one, ask whether it's still needed, whether it needs to load on every page, and whether it can be deferred or loaded after the page is interactive. Tag Manager itself can be used to delay non-critical tags until after first input or a few seconds into the session. Use the async or defer attributes on scripts that don't need to block rendering, and consider loading chat widgets only after a user interaction rather than on initial page load.
Video embeds deserve a special note. YouTube and Vimeo embeds load substantial code the moment they appear on the page, even if the visitor never plays the video. A façade approach (showing a static thumbnail that only loads the embed on click) eliminates that cost almost entirely, and takes a small amount of custom code in Webflow to implement.
For video you host yourself, the bandwidth impact can be just as significant as the performance impact. Tools like Vidzflow or Bunny.net host your videos outside of Webflow entirely, which means they load faster and do not count against your monthly bandwidth limit. If your site carries a lot of video content, that is worth factoring in early. Our guide on staying within your Webflow bandwidth limit covers this alongside other practical ways to keep your asset footprint under control.
How do Webflow interactions affect performance?
Webflow's Interactions panel is one of the platform's best features, but it's pure JavaScript under the hood. Stacking complex interactions on the same element, or running scroll-driven animations across an entire page, will hurt your INP score.
At BORING, we have largely moved away from Webflow Interactions in favour of custom animations and scripts. The performance benefits are clear: custom code gives you finer control over what loads and when, tends to produce cleaner output, and the results generally look better too. For decorative animations, CSS is almost always faster than JavaScript regardless of approach. A simple hover effect does not need an interaction or a custom script.
Lottie files are another common offender. A single uncompressed Lottie can weigh several hundred kilobytes and consume significant CPU during playback. Run your JSON files through LottieFiles' optimizer before uploading, and consider whether a static SVG or short MP4 might do the job. Video backgrounds should be heavily compressed, served at the lowest acceptable bitrate, and paired with a poster image so the page can render before the video loads.
How do CMS collections affect Webflow performance?
CMS-heavy pages (homepages pulling in featured posts, case studies, testimonials, and team members all at once) are easy to overload. Every collection list adds DOM nodes and increases initial render time.
Limit collection lists to what's actually visible above the fold, and use pagination or "load more" patterns for long lists. If your homepage queries five different collections, ask whether that's serving the user or just adding sections. Beyond CMS, look at the structural housekeeping: unused classes, orphaned styles, leftover interactions from old design iterations. Webflow's built-in tools make it easy to clean up unused styles in a single click. Do this regularly, especially after major redesigns.
Webflow hosting, CDN, and what's handled for you
A meaningful chunk of performance work is handled at the infrastructure level on Webflow. Knowing what the platform takes care of, and where its limits sit, helps you direct your effort to the places it actually pays off.
Every Webflow site is hosted on AWS and delivered via Fastly's global CDN, with SSL provisioned automatically and HTTP/2 enabled by default. Static assets are cached at the edge and served from the location closest to your visitor. For returning visitors, those cached assets load almost instantly. None of this requires configuration.
Using Webflow's built-in performance tools
Webflow has added a number of performance features directly to the platform, and they're worth using before you start writing custom code. Asset optimization, found under your project's Asset settings, controls automatic WebP conversion at delivery and enables responsive image variants. Confirm this is on for every project. Lazy loading is applied to images by default, which is the right behavior for everything below the fold, but for hero images that should load immediately, you'll want to disable lazy loading on those specific elements.
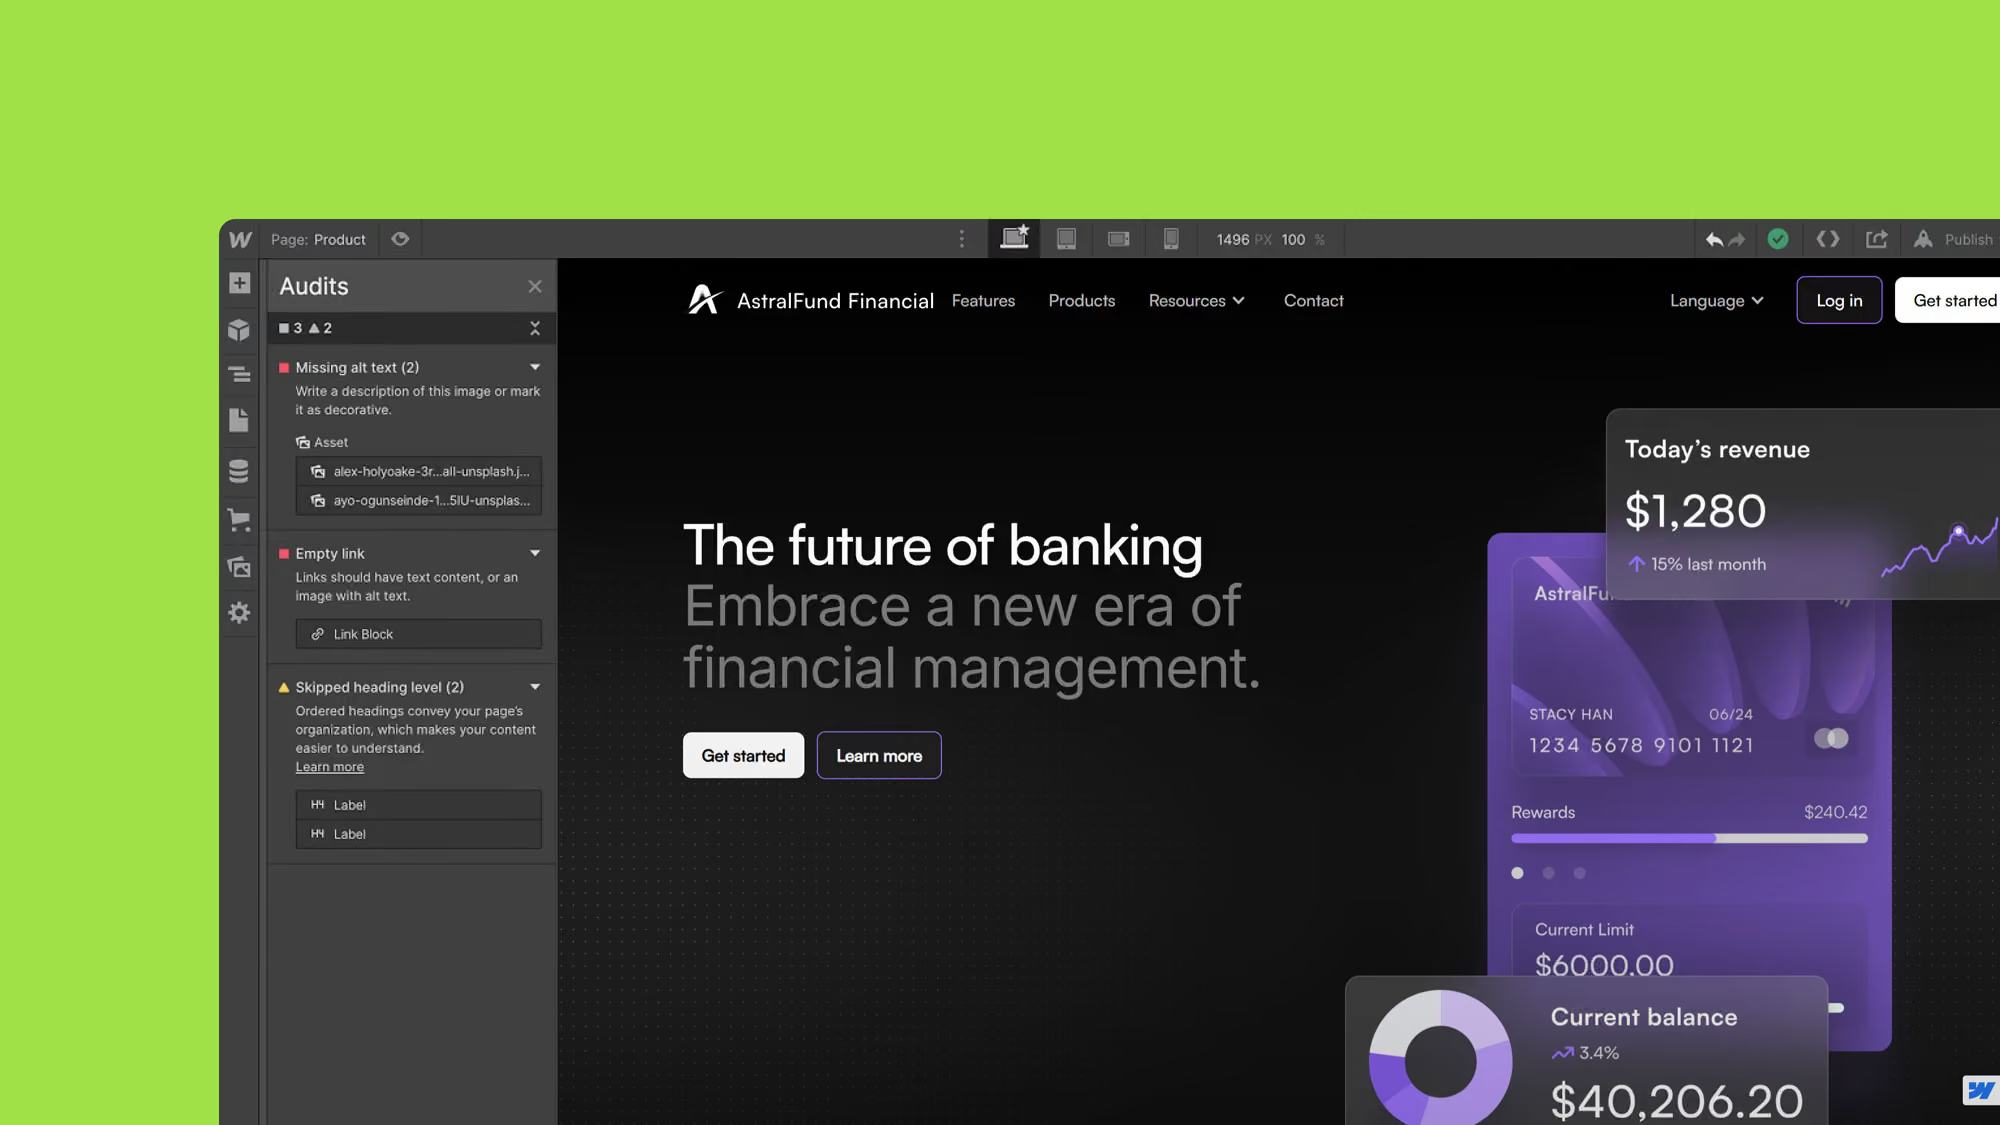
The Designer's audit panel flags common issues like missing alt text, empty links, and missing page titles. It isn't a performance auditor in the traditional sense, but it catches the small oversights that accumulate into real problems if left unchecked. Run it before launch and again after major content updates. If you're using Webflow Optimize for A/B testing, factor the script weight into your performance budget. Active experiments add weight to every page they run on, so keep them deliberate and time-bound.
How to audit your Webflow site's speed
You can't optimize what you don't measure. A repeatable audit gives you a clear picture of what's slowing your site down, and a baseline to track improvement against.
Start with PageSpeed Insights at pagespeed.web.dev. It runs your page through Lighthouse and returns Core Web Vitals scores alongside a prioritized list of issues. The mobile score is the one that matters most for SEO, so check that first. Run the test on your homepage, on key landing pages, and on any page you know carries heavy assets.
Then check Google Search Console's Core Web Vitals report. PageSpeed Insights gives you lab data, which is useful for diagnosis. Search Console gives you field data, which reflects how real visitors are experiencing your site. The two don't always agree, and when they diverge, field data is what Google uses for ranking.
For deeper diagnostics, open the page in Chrome and use DevTools' Network tab to see exactly what's loading, in what order, and how long each request takes. This is where slow third-party scripts, oversized assets, and render-blocking resources show up clearly. Finally, test on a real mid-range mobile device on a standard connection. Emulated mobile testing is useful but not the same as the real thing, and Google's scoring is benchmarked against actual mobile hardware. Record your scores before you start optimizing and after each significant change, so you have a reference point if things drift later.
Common Webflow performance mistakes to avoid
A few patterns come up again and again on slow Webflow sites:
- Treating Webflow as "fast by default" and skipping the audit. The platform gives you good fundamentals, not automatic top-tier performance.
- Uploading uncompressed hero images at full resolution and assuming Webflow will fix them on the way out. It will resize and serve WebP, but it won't recover the bytes you wasted.
- Loading too many font weights "just in case." Every weight is a separate file.
- Letting third-party scripts accumulate without auditing. The site that launched fast in January is rarely fast a year later.
- Optimizing only the homepage. CMS template pages are where most organic traffic lands, and they're often the heaviest.
- Mistaking a high Lighthouse score for actual performance. Field data is what Google uses for ranking.
Further reading


Check it out